ParaView Visualization
The section ParaView Support describes how to install Ascent
with ParaView support and how to run the example integrations using
insitu ParaView pipelines. In this section we describe in detail the
ParaView visualization pipeline for cloverleaf3d, one of the example
integrations, and we provide implementation details for the
Ascent ParaView integration.
The ParaView pipeline for cloverleaf3d
First we need to tell Ascent that we are using a Python script to visualize data using ascent-actions.json.
[
  {
    "action": "add_extracts",
    "extracts":
    {
      "e1":
      {
        "type": "python",
         "params":
         {
           "file": "paraview-vis.py"
         }
       }
    }
  }
]
The ParaView pipeline for the cloverleaf3d sample integration is in paraview-vis.py.
We use a variable count to be able to distinguish timestep 0, when
we setup the visualization pipeline. For all timesteps including
timestep 0, we execute the visualization pipeline we setup at
timestep 0.
try:
    count = count + 1
except NameError:
    count = 0
For timestep 0, we initialize ParaView,
if count == 0:
    import paraview
    paraview.options.batch = True
    paraview.options.symmetric = True
then we load the AscentSource plugin and we create the object
that presents the simulation data as a VTK dataset. We also create
a view of the same size as the image we want to save.
#
    LoadPlugin("@PARAVIEW_ASCENT_SOURCE@", remote=True, ns=globals())
    ascentSource = AscentSource()
    view = CreateRenderView()
    view.ViewSize = [1024, 1024]
From the VTK dataset, we select only the cells that are not ghosts and
show them colored by the energy scalar. Note that for a ParaView
filter that has no input specified, the output data from the previous
command in the program is used. So SelectCells uses the output
data from ascentSource.
#
    sel = SelectCells("vtkGhostType < 1")
    e = ExtractSelection(Selection=sel)
    rep = Show()
    ColorBy(rep, ("CELLS", "energy"))
We rescale the transfer function, show a scalar bar, and change the viewing direction
#
    transferFunction = GetColorTransferFunction('energy')
    transferFunction.RescaleTransferFunction(1, 5.5)
    renderView1 = GetActiveView()
    scalarBar = GetScalarBar(transferFunction, renderView1)
    scalarBar.Title = 'energy'
    scalarBar.ComponentTitle = ''
    scalarBar.Visibility = 1
    rep.SetScalarBarVisibility(renderView1, True)
    cam = GetActiveCamera()
    cam.Elevation(30)
    cam.Azimuth(-30)
For all timesteps, UpdateAscentData sets the new Ascent data and
marks the VTK source as modified. This insures that a new VTK dataset
will be computed when we need to Render. We also call
UpdatePropertyInformation which insures that property values are
available to the script. There are two properties setup on
AscentSource: Time (this represents the simulation time and is
the same as state/time in Conduit Blueprint Mesh
specification) and Cycle (this represents the simulation time step
when the visualization pipeline is called and is the same as
state/cycle in Conduit Blueprint Mesh
specification). After that, we ResetCamera so that the image fits
the screen properly, we render and save the image to a file.
ascentSource.UpdateAscentData()
ascentSource.UpdatePropertyInformation()
cycle = GetProperty(ascentSource, "Cycle").GetElement(0)
imageName = "image_{0:04d}.png".format(int(cycle))
ResetCamera()
Render()
SaveScreenshot(imageName, ImageResolution=(1024, 1024))
This script saves an image for each cycle with the image for
cycle 200 shown next.
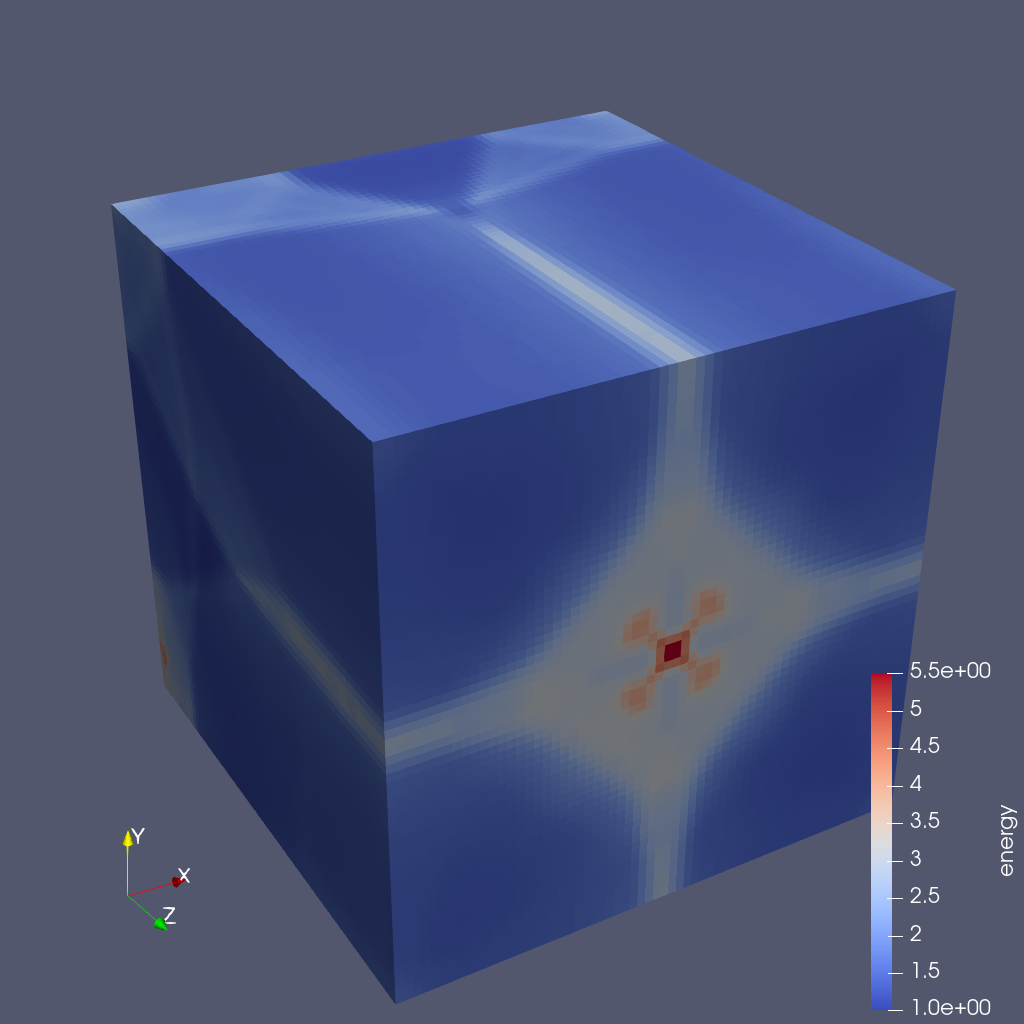
Fig. 60 CloverLeaf3D visualized with a ParaView pipeline
Implementation details
The Ascent ParaView integration is implemented in the src/examples/paraview-vis directory in the Ascent distribution.
AscentSource class, found in paraview_ascent_source.py,
derives from VTKPythonAlgorithmBase and produces one of the
following datasets: vtkImageData, vtkRectilinearGrid,
vtkStructuredGrid or vtkUnstructuredGrid. AscentSource
receives from an instrumented simulation a tree structure (json like)
that describes the simulation data using the Conduit Blueprint Mesh
specification. This data is converted to a VTK format using zero copy
for data arrays.
Global extents are not passed for the existing example integrations so
they are computed (using MPI communication) for uniform and
rectilinear topologies but they are not computed for a structured
topology (lulesh integration example). This means that for lulesh and
datasets that have a structured topology we cannot save a correct
parallel file that represents the whole dataset, unless the global
extents are passed from the simulation.
A ParaView pipeline for each sample simulation is specified in a
paraview-vis-XXX.py file where XXX is the name of the
simulation. In this file, we load the ParaView plugin and setup the
pipeline for timestep 0 and update the pipeline and save a screenshot
for each timestep of the simulation.