Transforming data with Pipelines
Pipelines are the construct used to compose filters that transform the published input data into new meshes. This is where users specify typical geometric transforms (e.g., clipping and slicing), field based transforms (e.g., threshold and contour), etc. The resulting data from each Pipeline can be used as input to Scenes or Extracts. Each pipeline contains one or more filters that transform the published mesh data. See Ascent’s Scenes docs for deeper details on Pipelines.
Calculating and rendering contours
#include "ascent.hpp"
#include "conduit_blueprint.hpp"

using namespace ascent;
using namespace conduit;

int main(int argc, char **argv)
{
    //create example mesh using the conduit blueprint braid helper

    Node mesh;
    conduit::blueprint::mesh::examples::braid("hexs",
                                              25,
                                              25,
                                              25,
                                              mesh);

    // Use Ascent to calculate and render contours

    Ascent a;

    // open ascent
    a.open();

    // publish mesh to ascent
    a.publish(mesh);

    // setup actions
    Node actions;
    Node &add_act = actions.append();
    add_act["action"] = "add_pipelines";
    Node &pipelines = add_act["pipelines"];

    // create a  pipeline (pl1) with a contour filter (f1)
    pipelines["pl1/f1/type"] = "contour";

    // extract contours where braid variable
    // equals 0.2 and 0.4
    Node &contour_params = pipelines["pl1/f1/params"];
    contour_params["field"] = "braid";

    double iso_vals[2] = {0.2, 0.4};
    contour_params["iso_values"].set(iso_vals,2);

    // declare a scene to render the pipeline result

    Node &add_act2 = actions.append();
    add_act2["action"] = "add_scenes";
    Node & scenes = add_act2["scenes"];

    // add a scene (s1) with one pseudocolor plot (p1) that
    // will render the result of our pipeline (pl1)
    scenes["s1/plots/p1/type"] = "pseudocolor";
    scenes["s1/plots/p1/pipeline"] = "pl1";
    scenes["s1/plots/p1/field"] = "braid";
    // set the output file name (ascent will add ".png")
    scenes["s1/image_name"] = "out_pipeline_ex1_contour";

    // print our full actions tree
    std::cout << actions.to_yaml() << std::endl;

    // execute the actions
    a.execute(actions);

    a.close();
}
import conduit
import conduit.blueprint
import ascent
import numpy as np


mesh = conduit.Node()
conduit.blueprint.mesh.examples.braid("hexs",
                                      25,
                                      25,
                                      25,
                                      mesh)

# Use Ascent to calculate and render contours
a = ascent.Ascent()
a.open()

# publish our mesh to ascent
a.publish(mesh)

# setup actions
actions = conduit.Node()
add_act = actions.append()
add_act["action"] = "add_pipelines"
pipelines = add_act["pipelines"]

# create a  pipeline (pl1) with a contour filter (f1)
pipelines["pl1/f1/type"] = "contour"

# extract contours where braid variable
# equals 0.2 and 0.4
contour_params = pipelines["pl1/f1/params"]
contour_params["field"] = "braid"
iso_vals = np.array([0.2, 0.4],dtype=np.float32)
contour_params["iso_values"].set(iso_vals)

# declare a scene to render the pipeline result

add_act2 = actions.append()
add_act2["action"] = "add_scenes"
scenes = add_act2["scenes"]

# add a scene (s1) with one pseudocolor plot (p1) that
# will render the result of our pipeline (pl1)
scenes["s1/plots/p1/type"] = "pseudocolor"
scenes["s1/plots/p1/pipeline"] = "pl1"
scenes["s1/plots/p1/field"] = "braid"
# set the output file name (ascent will add ".png")
scenes["s1/image_name"] = "out_pipeline_ex1_contour"

# print our full actions tree
print(actions.to_yaml())

# execute the actions
a.execute(actions)

a.close()
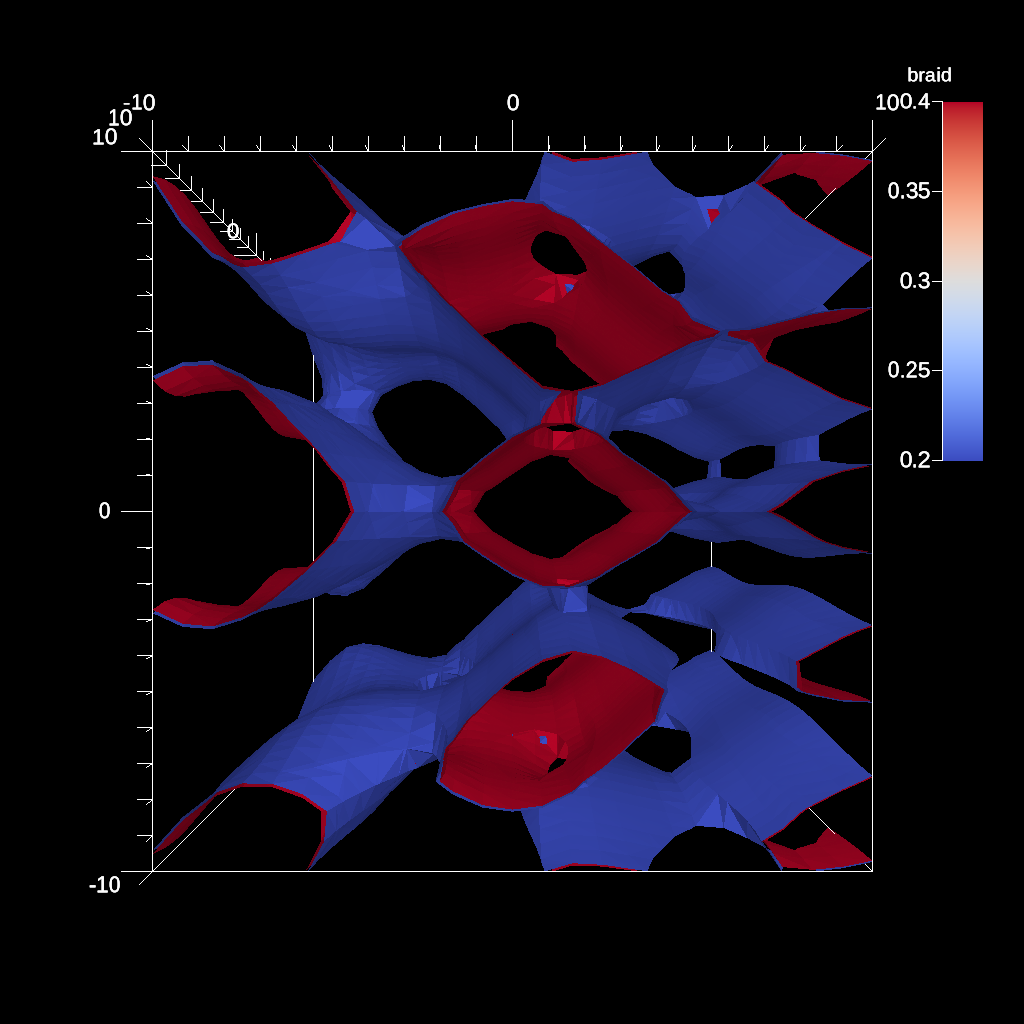
Fig. 12 Render of contour pipeline result
Combining threshold and clip transforms
#include "ascent.hpp"
#include "conduit_blueprint.hpp"

using namespace ascent;
using namespace conduit;

int main(int argc, char **argv)
{
    //create example mesh using the conduit blueprint braid helper

    Node mesh;
    conduit::blueprint::mesh::examples::braid("hexs",
                                              25,
                                              25,
                                              25,
                                              mesh);
    Ascent a;

    // open ascent
    a.open();

    // publish mesh to ascent
    a.publish(mesh);

    // setup actions
    Node actions;
    Node &add_act = actions.append();
    add_act["action"] = "add_pipelines";
    Node &pipelines = add_act["pipelines"];

    // create a  pipeline (pl1) with a threshold filter (f1)
    // and a clip filter (f2)

    // add our threshold (f1)
    pipelines["pl1/f1/type"] = "threshold";
    Node &thresh_params = pipelines["pl1/f1/params"];
    // set threshold parameters
    // keep elements with values between 0.0 and 0.5
    thresh_params["field"]  = "braid";
    thresh_params["min_value"] = 0.0;
    thresh_params["max_value"] = 0.5;

    // add our clip (f2)
    pipelines["pl1/f2/type"]   = "clip";
    Node &clip_params = pipelines["pl1/f2/params"];
    // set clip parameters
    // use spherical clip
    clip_params["sphere/center/x"] = 0.0;
    clip_params["sphere/center/y"] = 0.0;
    clip_params["sphere/center/z"] = 0.0;
    clip_params["sphere/radius"]   = 12;

    //  declare a scene to render the pipeline results
    Node &add_act2 = actions.append();
    add_act2["action"] = "add_scenes";
    Node &scenes = add_act2["scenes"];

    // add a scene (s1) with one pseudocolor plot (p1) that
    // will render the result of our pipeline (pl1)
    scenes["s1/plots/p1/type"] = "pseudocolor";
    scenes["s1/plots/p1/pipeline"] = "pl1";
    scenes["s1/plots/p1/field"] = "braid";
    // set the output file name (ascent will add ".png")
    scenes["s1/image_name"] = "out_pipeline_ex2_thresh_clip";

    // print our full actions tree
    std::cout << actions.to_yaml() << std::endl;

    // execute the actions
    a.execute(actions);

    a.close();
}
import conduit
import conduit.blueprint
import ascent
import numpy as np


mesh = conduit.Node()
conduit.blueprint.mesh.examples.braid("hexs",
                                      25,
                                      25,
                                      25,
                                      mesh)

# Use Ascent to clip and threshold data
a = ascent.Ascent()
a.open()

# publish mesh to ascent
a.publish(mesh)

# setup actions
actions = conduit.Node()
add_act = actions.append()
add_act["action"] = "add_pipelines"
pipelines = add_act["pipelines"]

# create a  pipeline (pl1) with a threshold filter (f1)
# and a clip filter (f2)

# add our threshold (f1)
pipelines["pl1/f1/type"] = "threshold"
thresh_params = pipelines["pl1/f1/params"]
# set threshold parameters
# keep elements with values between 0.0 and 0.5
thresh_params["field"]  = "braid"
thresh_params["min_value"] = 0.0
thresh_params["max_value"] = 0.5

# add our clip (f2)
pipelines["pl1/f2/type"]   = "clip"
clip_params = pipelines["pl1/f2/params"]
# set clip parameters
# use spherical clip
clip_params["sphere/center/x"] = 0.0
clip_params["sphere/center/y"] = 0.0
clip_params["sphere/center/z"] = 0.0
clip_params["sphere/radius"]   = 12

#  declare a scene to render the pipeline results
add_act2 = actions.append()
add_act2["action"] = "add_scenes"
scenes = add_act2["scenes"]

# add a scene (s1) with one pseudocolor plot (p1) that
# will render the result of our pipeline (pl1)
scenes["s1/plots/p1/type"] = "pseudocolor"
scenes["s1/plots/p1/pipeline"] = "pl1"
scenes["s1/plots/p1/field"] = "braid"
# set the output file name (ascent will add ".png")
scenes["s1/image_name"] = "out_pipeline_ex2_thresh_clip"

# print our full actions tree
print(actions.to_yaml())

# execute
a.execute(actions)

# close ascent
a.close()
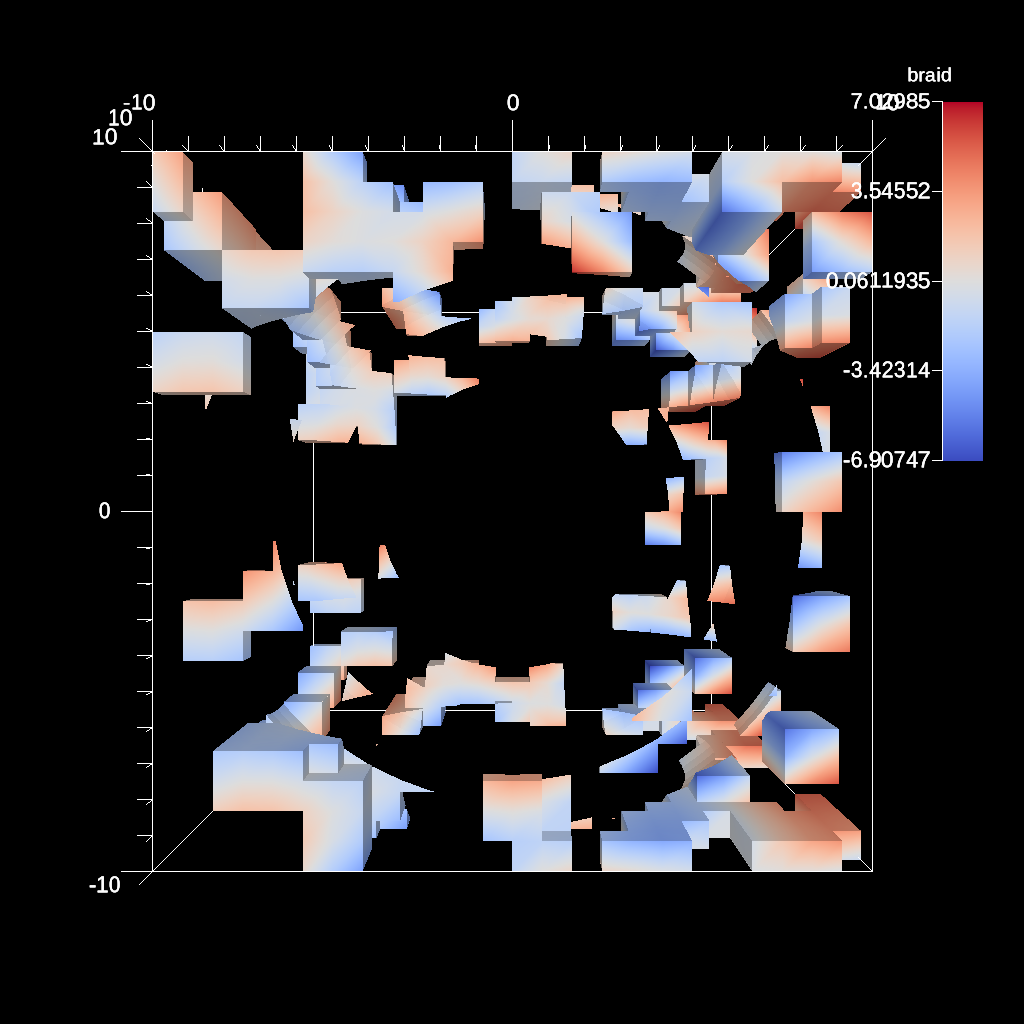
Fig. 13 Render of threshold and clip pipeline result
Creating and rendering the multiple pipelines
#include "ascent.hpp"
#include "conduit_blueprint.hpp"

using namespace ascent;
using namespace conduit;

int main(int argc, char **argv)
{
    //create example mesh using the conduit blueprint braid helper

    Node mesh;
    conduit::blueprint::mesh::examples::braid("hexs",
                                              25,
                                              25,
                                              25,
                                              mesh);
    Ascent a;

    // open ascent
    a.open();

    // publish mesh to ascent
    a.publish(mesh);

    // setup actions
    Node actions;
    Node &add_act = actions.append();
    add_act["action"] = "add_pipelines";
    Node &pipelines = add_act["pipelines"];

    // create our first pipeline (pl1)
    // with a contour filter (f1)
    pipelines["pl1/f1/type"] = "contour";
    // extract contours where braid variable
    // equals 0.2 and 0.4
    Node &contour_params = pipelines["pl1/f1/params"];
    contour_params["field"] = "braid";
    double iso_vals[2] = {0.2, 0.4};
    contour_params["iso_values"].set(iso_vals,2);

    // create our second pipeline (pl2) with a threshold filter (f1)
    // and a clip filter (f2)

    // add our threshold (pl2 f1)
    pipelines["pl2/f1/type"] = "threshold";
    Node &thresh_params = pipelines["pl2/f1/params"];
    // set threshold parameters
    // keep elements with values between 0.0 and 0.5
    thresh_params["field"]  = "braid";
    thresh_params["min_value"] = 0.0;
    thresh_params["max_value"] = 0.5;

    // add our clip (pl2 f2)
    pipelines["pl2/f2/type"]   = "clip";
    Node &clip_params = pipelines["pl2/f2/params"];
    // set clip parameters
    // use spherical clip
    clip_params["sphere/center/x"] = 0.0;
    clip_params["sphere/center/y"] = 0.0;
    clip_params["sphere/center/z"] = 0.0;
    clip_params["sphere/radius"]   = 12;

    // declare a scene to render our pipeline results
    Node &add_act2 = actions.append();
    add_act2["action"] = "add_scenes";
    Node &scenes = add_act2["scenes"];

    // add a scene (s1) with two pseudocolor plots
    // (p1 and p2) that will render the results
    // of our pipelines (pl1 and pl2)## Pipeline Example 2:

    // plot (p1) to render our first pipeline (pl1)
    scenes["s1/plots/p1/type"] = "pseudocolor";
    scenes["s1/plots/p1/pipeline"] = "pl1";
    scenes["s1/plots/p1/field"] = "braid";
    // plot (p2) to render our second pipeline (pl2)
    scenes["s1/plots/p2/type"] = "pseudocolor";
    scenes["s1/plots/p2/pipeline"] = "pl2";
    scenes["s1/plots/p2/field"] = "braid";
    // set the output file name (ascent will add ".png")
    scenes["s1/image_name"] = "out_pipeline_ex3_two_plots";

    // print our full actions tree
    std::cout << actions.to_yaml() << std::endl;

    // execute the actions
    a.execute(actions);

    a.close();
}
import conduit
import conduit.blueprint
import ascent
import numpy as np


mesh = conduit.Node()
conduit.blueprint.mesh.examples.braid("hexs",
                                      25,
                                      25,
                                      25,
                                      mesh)

# Use Ascent to create and render multiple pipelines
a = ascent.Ascent()
a.open()

# publish mesh to ascent
a.publish(mesh)

# setup actions
actions = conduit.Node()
add_act = actions.append()
add_act["action"] = "add_pipelines"
pipelines = add_act["pipelines"]

# create our first pipeline (pl1)
# with a contour filter (f1)
pipelines["pl1/f1/type"] = "contour"
# extract contours where braid variable
# equals 0.2 and 0.4
contour_params = pipelines["pl1/f1/params"]
contour_params["field"] = "braid"
iso_vals = np.array([0.2, 0.4],dtype=np.float32)
contour_params["iso_values"].set(iso_vals)

# create our second pipeline (pl2) with a threshold filter (f1)
# and a clip filter (f2)

# add our threshold (pl2 f1)
pipelines["pl2/f1/type"] = "threshold"
thresh_params = pipelines["pl2/f1/params"]
# set threshold parameters
# keep elements with values between 0.0 and 0.5
thresh_params["field"]  = "braid"
thresh_params["min_value"] = 0.0
thresh_params["max_value"] = 0.5


# add our clip (pl2 f2)
pipelines["pl2/f2/type"]   = "clip"
clip_params = pipelines["pl2/f2/params"]
# set clip parameters
# use spherical clip
clip_params["sphere/center/x"] = 0.0
clip_params["sphere/center/y"] = 0.0
clip_params["sphere/center/z"] = 0.0
clip_params["sphere/radius"]   = 12

# declare a scene to render our pipeline results
add_act2 = actions.append()
add_act2["action"] = "add_scenes"
scenes = add_act2["scenes"]

# add a scene (s1) with two pseudocolor plots
# (p1 and p2) that will render the results
# of our pipelines (pl1 and pl2)## Pipeline Example 2:

# plot (p1) to render our first pipeline (pl1)
scenes["s1/plots/p1/type"] = "pseudocolor"
scenes["s1/plots/p1/pipeline"] = "pl1"
scenes["s1/plots/p1/field"] = "braid"
# plot (p2) to render our second pipeline (pl2)
scenes["s1/plots/p2/type"] = "pseudocolor"
scenes["s1/plots/p2/pipeline"] = "pl2"
scenes["s1/plots/p2/field"] = "braid"
# set the output file name (ascent will add ".png")
scenes["s1/image_name"] = "out_pipeline_ex3_two_plots"

# print our full actions tree
print(actions.to_yaml())

# execute
a.execute(actions)

# close ascent
a.close()
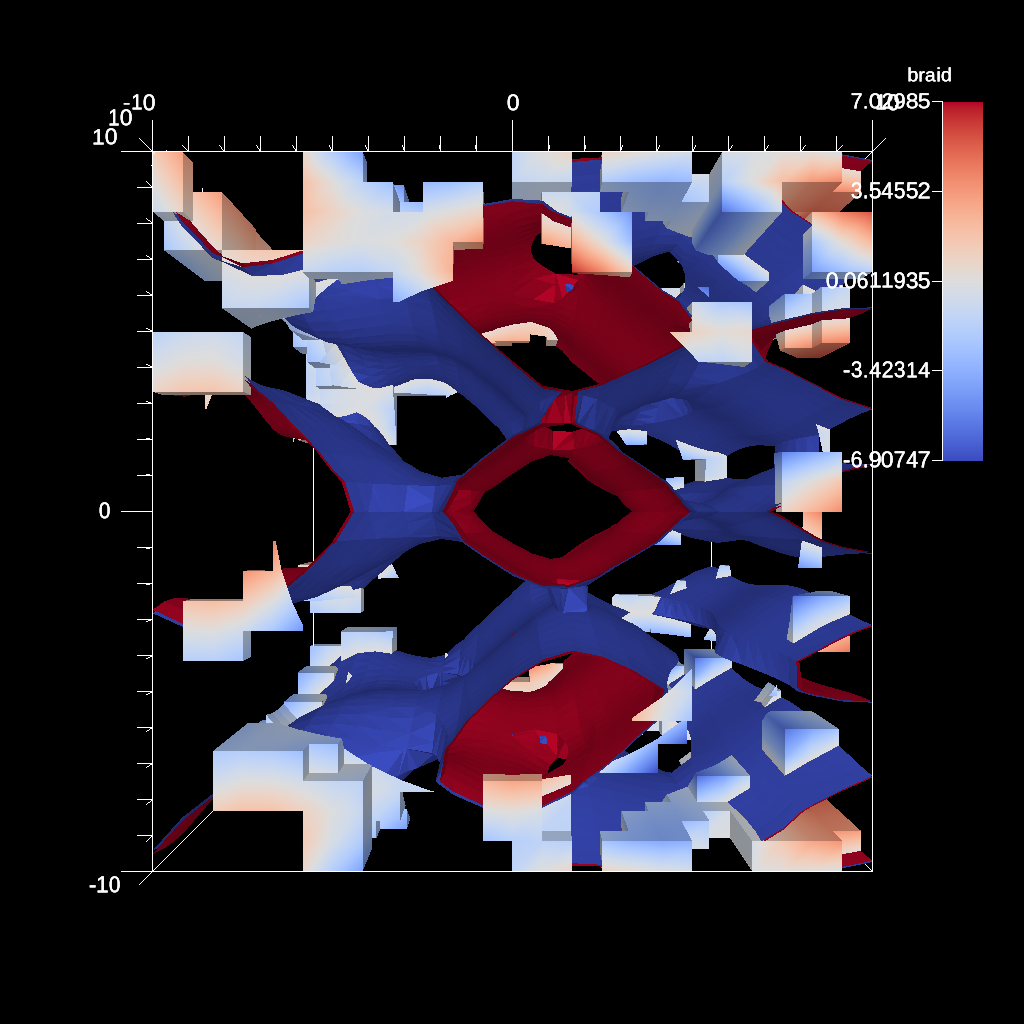
Fig. 14 Render of multiple pipeline results